
Ultra Fine Dust Level Prediction for Daily life 🐼
‘The’ harsh winter cold begins to fade, and when spring comes, ultrafine dust slowly begins to increase with the monsoon blowing from China. Ultrafine dust has now become our daily seasonal phenomenon with yellow dust in the spring. So, we need to batten down the hatch more than ever.
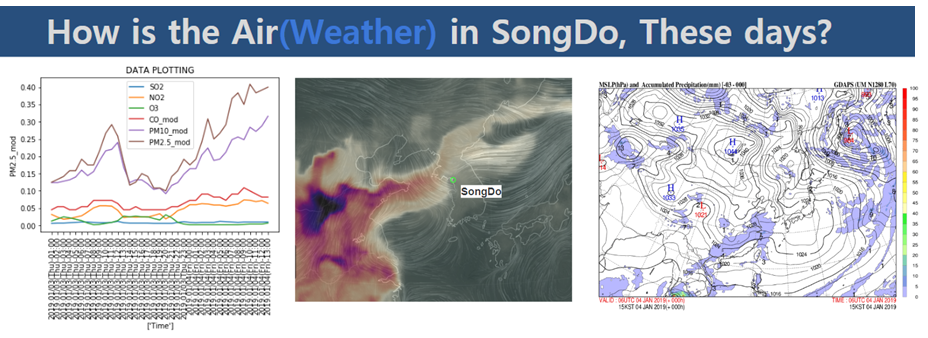
‘How’ is the weather in your city right now? okay, let us ask it another way. how is the air around you? If it is a sunny sky and a fresh breeze, you would be a one of a few happy people out of people around the world. the more industrialized the place we live in, the more unhealthy air we have to inhale around us. especially the toxins that are produced from the exhaust gas from the combustion which is made from a factory or vehicle.
Here Songdo Int’l City in Incheon as a western harbor city near Seoul in Korea is face to the east coastline which is the most industrialized area of China. a ton of ultra-fine dust is carried by the monsoon which is direct from north to south in winter vise versa in summer. moreover, when in winter, the steep consumption of fuel for heating individual houses lead to produce much combustion gases.
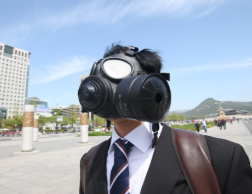
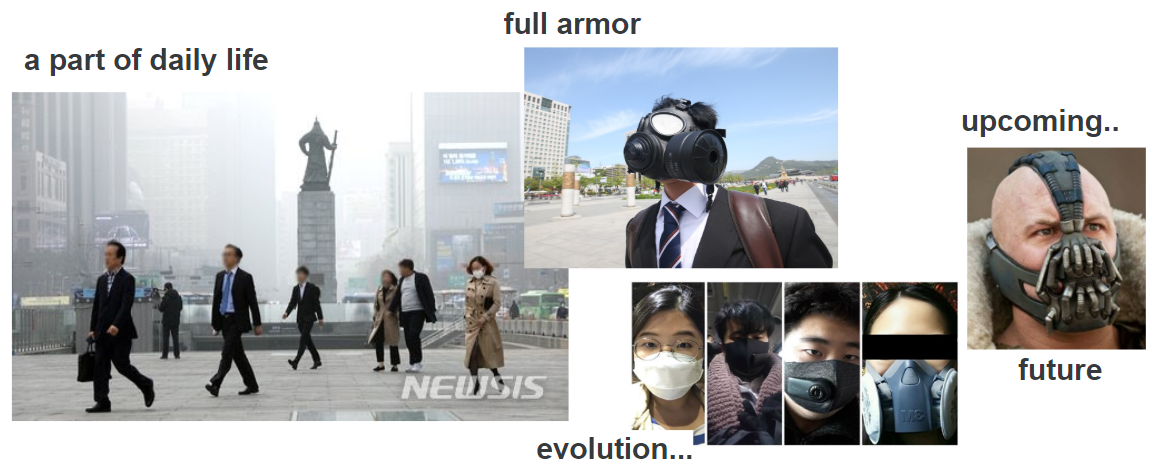 ‘The’ ultra-fine dust is unfortunately our daily life. we have to put on a mask almost every day when winter-spring comes because ultra-fine dust is a toxin moreover it carries a lot of industrial chemicals. thus putting on a mask is a necessity in winter-spring.
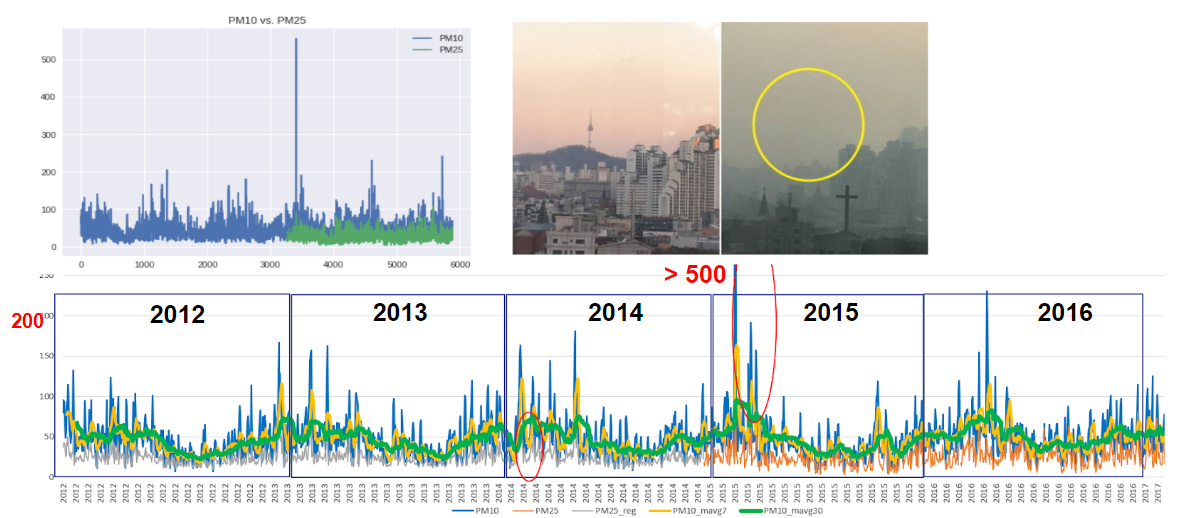
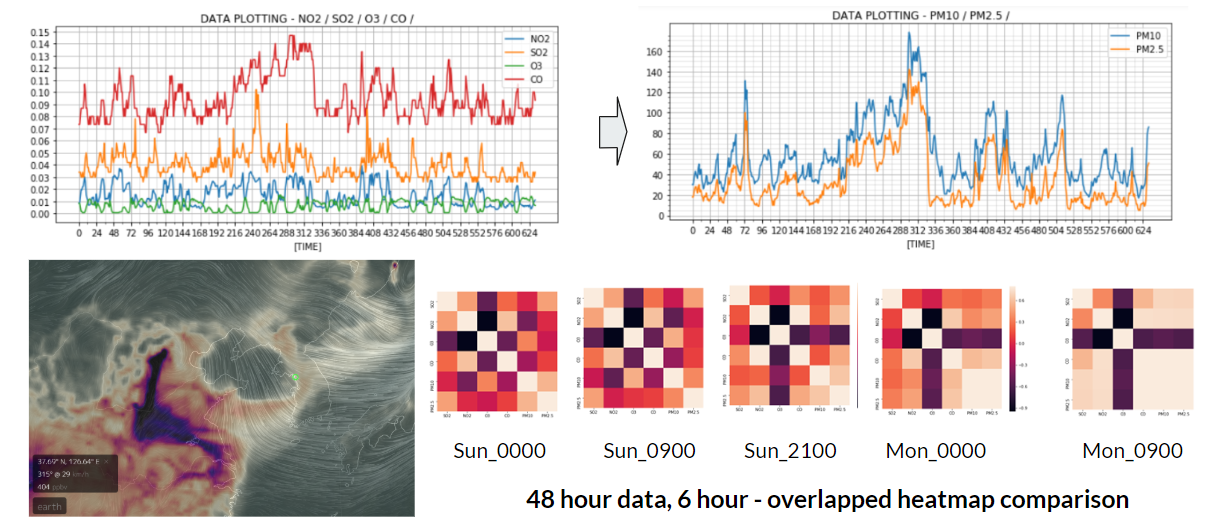
the monsoon changes its direction by season. as the below chart shows, the concentration of ultra-fine dust has obvious seasonal repetition trend that shows a strong concentration in winter-spring, weak in summer-autumn due to the competition of the high atmospheric pressure of continent and the low pressure of the pacific ocean.
seasonal repeatation
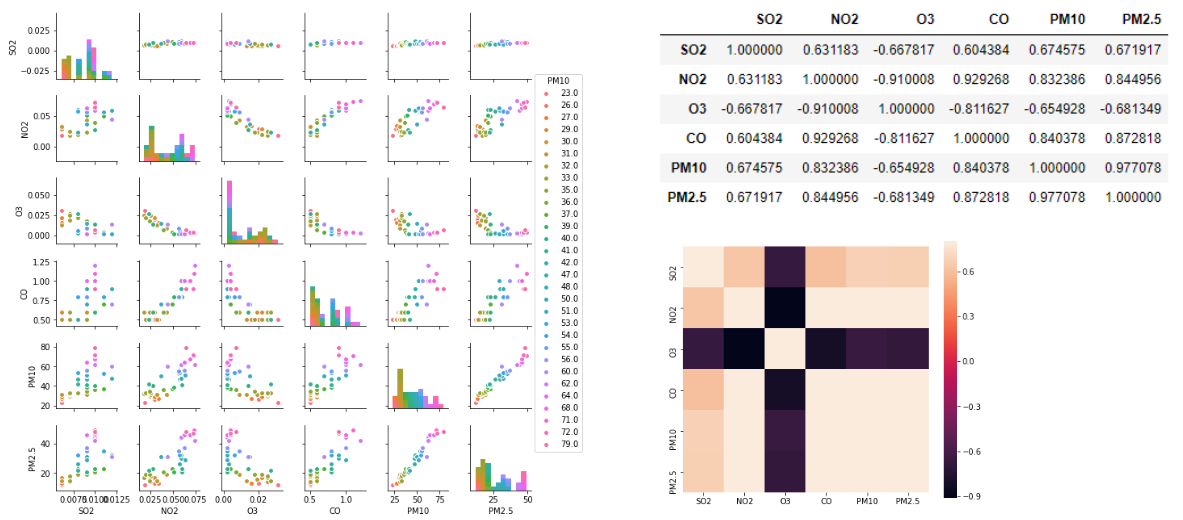
‘If’ we look at the mutual correlation of the four chemical compounds - SO2, NO2, O3, CO - that are closely related to the amount of the two products - PM2.5 and PM10, which are targets for wanting to know - that we want to know the final change. we can see that the proportional or inverse relationship between each component is very obvious.
The particularly noticeable fact is that O3 has a firm and distinct inverse relationship to all other factors. And the other factors, except O3, although differ in degree, but it is generally noticed that they have a strong or weak proportional relationship one and another. This is where you can understand why this correlation targets 4 + 2 chemical bonds to measure air quality.
‘In’ terms of this, I think it can be hypothesized that when the signs of changes in the amount of fine dust start to be detected, for example, If a certain unstable chemical component that is unknown may affect to this balance of the correlations of the six factors and then will gradually turn into an unstable situation.
It is suggested as a hypothesis, but in a stable balance, it can detect the change immediately using the correlation of factors when signs of change begin to appear.
We believe that this can detect signs before a trend occurs. In other words, it is judged that this chart showing the correlation of each component can be used as a predictor of when the change starts and ends in a stable state.
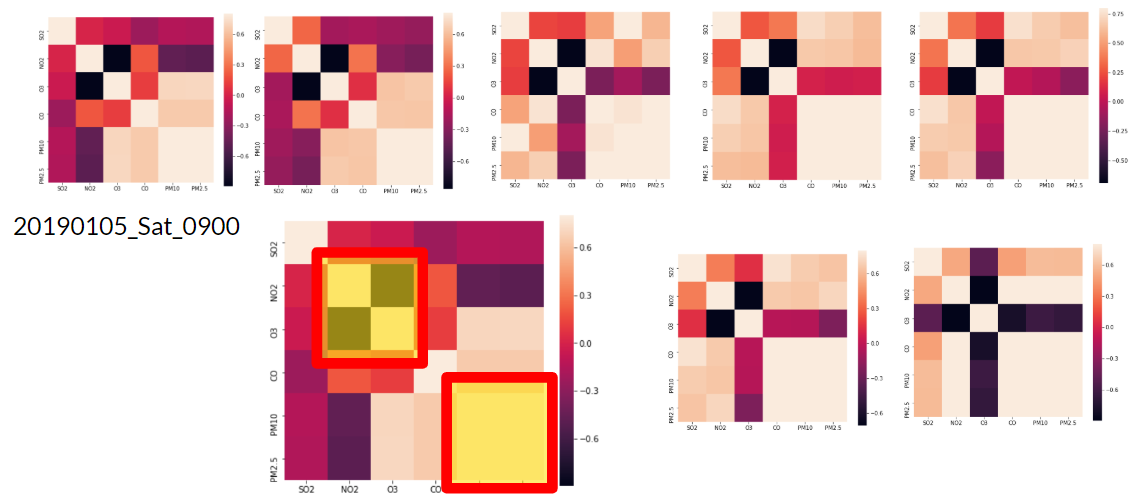
‘If It can do that, you will be able to create a visual tool system such as a barcode which has compressed idea based on the six factors data values provided every hour. And by listing this barcode generated in 1-hour increments, we expect that it can be used as a barometer can detect the changes in fine dust concentration in advance.
The service I imagine is intended to provide convenience based on this.
In addition, if it can accumulate the amount of change so far as a form of a time history graph and give a prediction for the future, for example, 12 hours or 24 hours from the previous, it can be a very flexible and handy service to users who plan their outdoor activity schedule.
‘In a nutshell, there are three things I want to make it a service are below.
- The first is a simple visual code system that can explain complicated environmental changes at a glance.
- The second is that as a form of the chart it will show the accumulated record of the past.
- Third, forecast the future in a certain time-span upcoming, like 12hours, 24hours.
- The visual QR code system provides visually easy information on how long the steady-state is continuing and the signs of change begin - example: the clean air was stable for the third day, but suddenly it started to deteriorate.
- The data chart that has been accumulated from the past can be used as a subject to create a story associated with each individual. (Social media, blogs, etc.)-Example: Yesterday when I went on a picnic, was the cleanest weather this year.
- The fine dust forecasting system can help to schedule outdoor activities. - Example: I want to plan a tennis meeting tomorrow afternoon, but will fine dust get better?
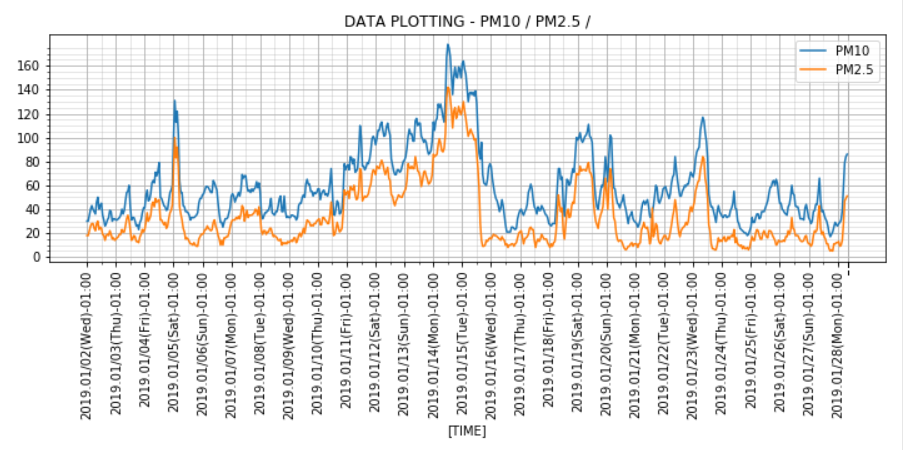
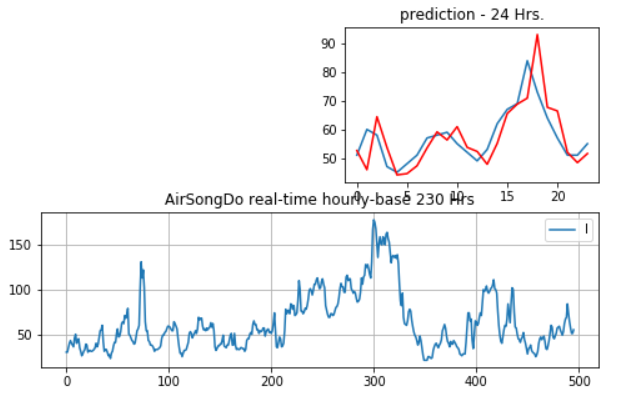
The chart shown below is data that stores the amount of fine dust fluctuations in the Songdo area in one-hour increments for 500 hours (about 21 days) from January 1 of this year, and the 24-hours prediction graph at the top of it is made using ‘ARIMA Model’. Of course, it is not that simple problem that can be solved by one simple prediction model like ‘ARIMA’.
Written on ... February 17, 2019